Coerce to Phases
Usage
as_phases(from, ...)

# S4 method for class 'matrix'
as_phases(
  from,
  calendar = get_calendar(),
  start = seq(from = 1, to = ncol(from), by = 2),
  stop = start + 1,
  names = NULL,
  iteration = NULL
)

# S4 method for class 'data.frame'
as_phases(
  from,
  calendar = get_calendar(),
  start = seq(from = 1, to = ncol(from), by = 2),
  stop = start + 1,
  names = NULL,
  iteration = NULL
)
Arguments
- from
from An object to be coerced.
- ...
Currently not used.
- calendar
A
aion::TimeScaleobject specifying the source calendar (seeaion::calendar()).- start
An
integervector specifying the index of the columns corresponding to the beginning of the phases. If missing, every other column is used starting from the first column (after deleting theiterationcolumn, if any).- stop
An
integervector specifying the index of the columns corresponding to the end of the phases. If missing, every other column is used starting from the second column (after deleting theiterationcolumn, if any).- names
A
charactervector giving the names of the phases.- iteration
A length-one
numericvector specifying the index of the iteration column.
Value
A PhasesMCMC object.
See also
Other read methods:
as_coda(),
as_events(),
check,
read_bcal(),
read_chronomodel,
read_oxcal()
Examples
## Coerce to phases
(pha <- as_phases(mcmc_phases, calendar = CE(), start = c(1, 3), iteration = 1))
#> <PhasesMCMC>
#> - Number of phases: 2
#> - Number of MCMC samples: 30000
summary(pha, calendar = CE())
#> $P1
#>           mad mean  sd   min   q1 median   q3  max start  end
#> start    -708 -773 148 -1349 -890   -749 -671 -207 -1059 -501
#> end      -690 -521 169 -1050 -670   -537 -384   -5  -776 -214
#> duration  278  253 138     1  151    249  345  880     1  487
#>
#> $P2
#>            mad  mean  sd   min    q1 median    q3   max start   end
#> start    -1766 -1785 100 -2000 -1857  -1785 -1719 -1223 -1981 -1611
#> end      -1240 -1235  87 -1833 -1289  -1235 -1181  -719 -1404 -1067
#> duration   561   551 132     5   464    552   639  1157   297   806
#>

## Plot phases
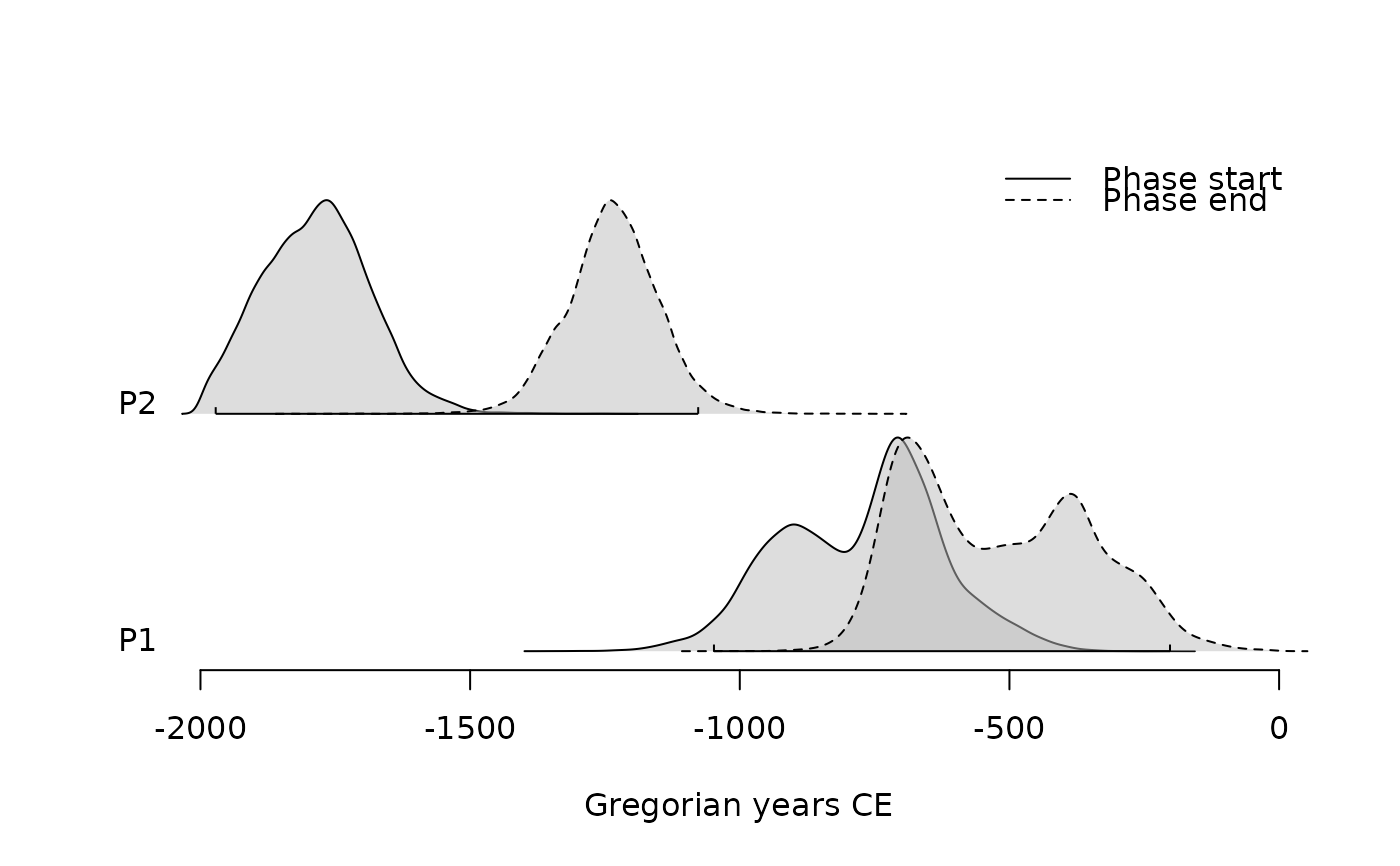
plot(pha)

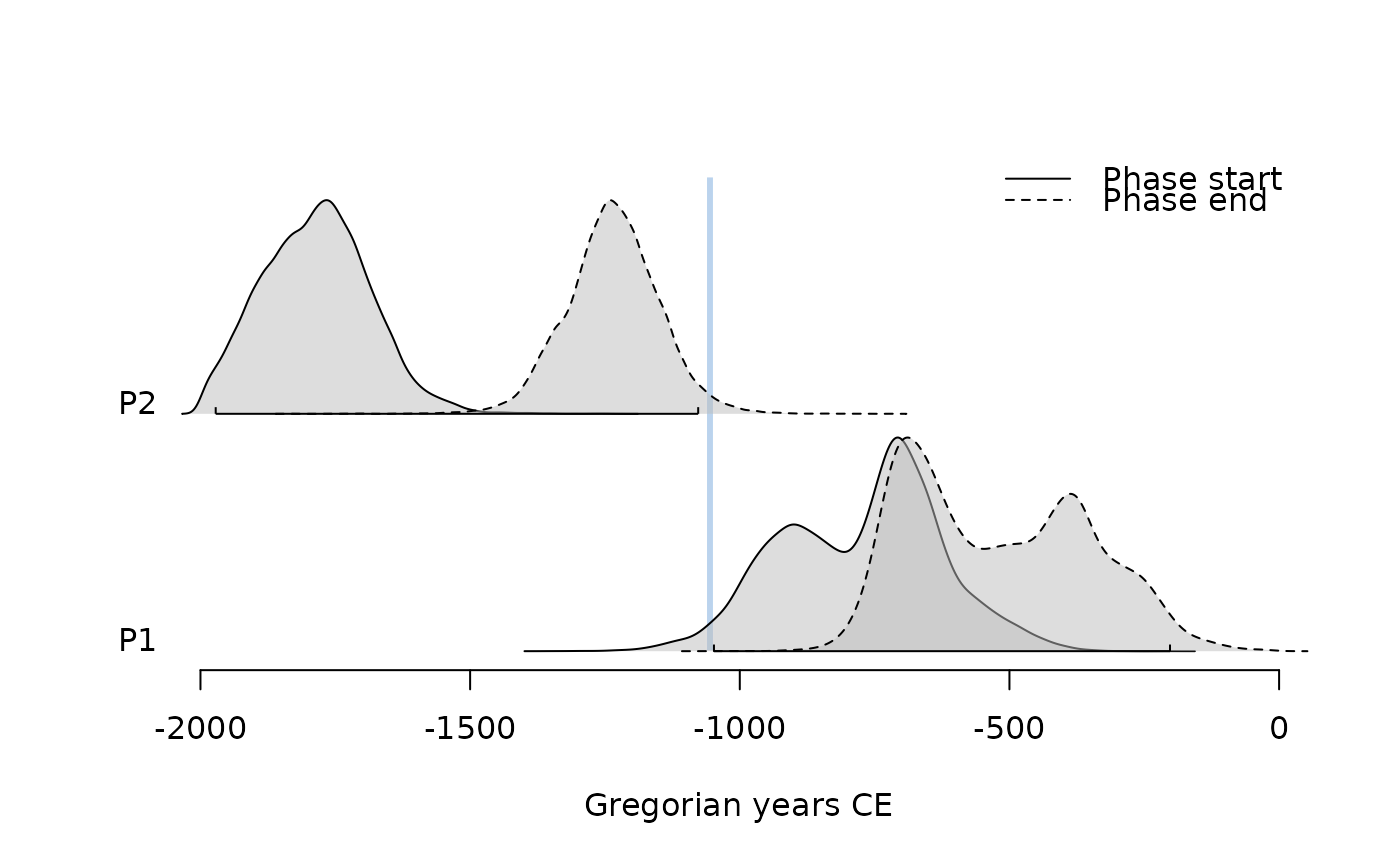
plot(pha, succession = "hiatus")

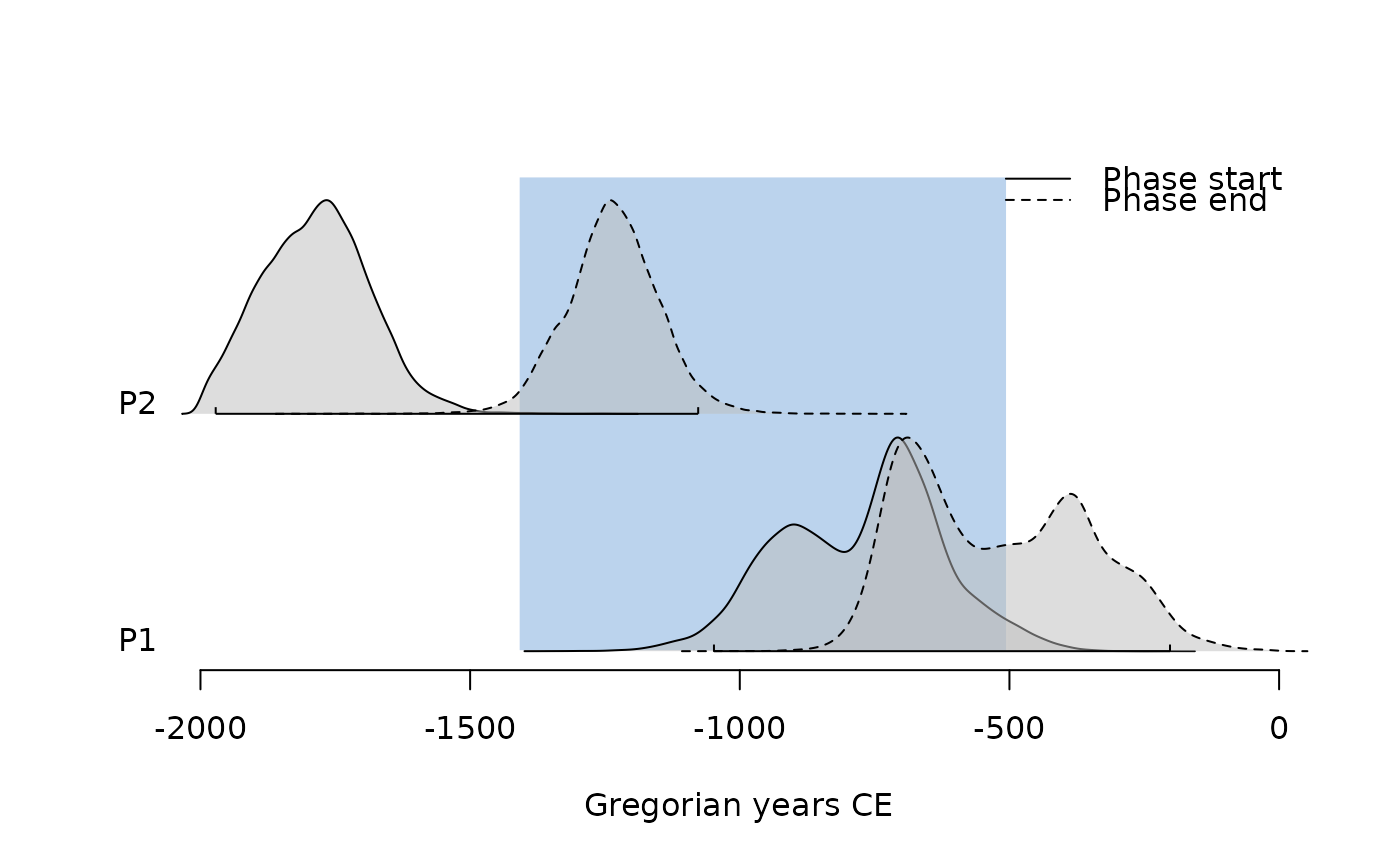
plot(pha, succession = "transition")


## Compute phases from events
(eve <- as_events(mcmc_events, calendar = CE(), iteration = 1))
#> <EventsMCMC>
#> - Number of events: 4
#> - Number of MCMC samples: 30000

## Compute min-max range for all chains
pha1 <- phases(eve)
summary(pha1, calendar = CE())
#> $P1
#>            mad  mean  sd   min    q1 median    q3   max start   end
#> start    -1766 -1785 100 -2000 -1857  -1785 -1719 -1223 -1981 -1611
#> end       -690  -521 169 -1050  -670   -537  -384    -5  -776  -214
#> duration  1167  1265 196   483  1116   1253  1411  1947   915  1637
#>

## Compute min-max range by group
pha2 <- phases(eve, groups = list(phase_1 = c(1, 3), phase_2 = c(2, 4)))
summary(pha2, calendar = CE())
#> $phase_1
#>           mad mean  sd   min   q1 median   q3  max start  end
#> start    -708 -773 148 -1349 -890   -749 -671 -207 -1059 -501
#> end      -690 -521 169 -1050 -670   -537 -384   -5  -776 -214
#> duration  278  253 138     1  151    249  345  880     1  487
#>
#> $phase_2
#>            mad  mean  sd   min    q1 median    q3   max start   end
#> start    -1766 -1785 100 -2000 -1857  -1785 -1719 -1223 -1981 -1611
#> end      -1240 -1235  87 -1833 -1289  -1235 -1181  -719 -1404 -1067
#> duration   561   551 132     5   464    552   639  1157   297   806
#>