A statistical graphic designed for the archaeological study of when events of a specified kind occurred.

occurrence(object, ...)

# S4 method for EventsMCMC
occurrence(object, level = 0.95)

# S4 method for OccurrenceEvents,missing
plot(
  x,
  calendar = getOption("ArchaeoPhases.calendar"),
  main = NULL,
  sub = NULL,
  ann = graphics::par("ann"),
  axes = TRUE,
  frame.plot = axes,
  panel.first = NULL,
  panel.last = NULL,
  ...
)

Arguments

object

An EventsMCMC object.

...

Other graphical parameters may also be passed as arguments to this function, particularly, border, col, lwd, lty or pch.

level

A length-one numeric vector giving the confidence level.

x

An OccurrenceEvents object.

calendar

A TimeScale object specifying the target calendar (see calendar()).

main

A character string giving a main title for the plot.

sub

A character string giving a subtitle for the plot.

ann

A logical scalar: should the default annotation (title and x and y axis labels) appear on the plot?

axes

A logical scalar: should axes be drawn on the plot?

frame.plot

A logical scalar: should a box be drawn around the plot?

panel.first

An an expression to be evaluated after the plot axes are set up but before any plotting takes place. This can be useful for drawing background grids.

panel.last

An expression to be evaluated after plotting has taken place but before the axes, title and box are added.

Value

  • occurrence() returns an OccurrenceEvents object.

  • plot() is called it for its side-effects: it results in a graphic being displayed (invisibly returns x).

An OccurrenceEvents object.

Details

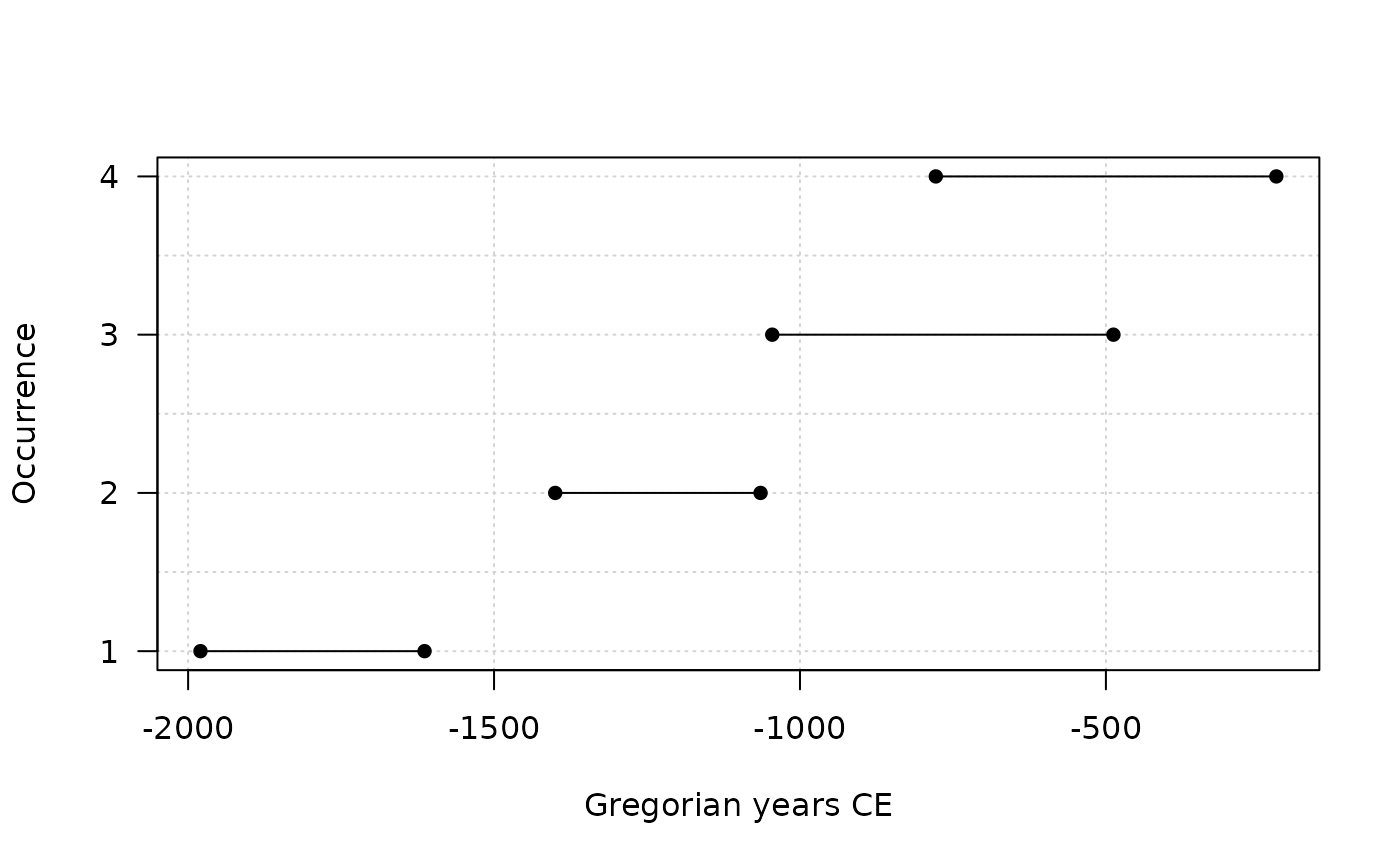
If we have \(k\) events, then we can estimate the calendar date \(t\) corresponding to the smallest date such that the number of events observed before \(t\) is equal to \(k\).

The occurrence() estimates these occurrences and gives the credible interval or the highest posterior density (HPD) region for a given level of confidence.

See also

Other event tools: activity(), elapse(), tempo()

Author

A. Philippe, M.-A. Vibet, T. S. Dye, N. Frerebeau

Examples

## Coerce to MCMC
eve <- as_events(mcmc_events, calendar = CE(), iteration = 1)
eve <- eve[1:10000, ]

## Occurrence plot
occ <- occurrence(eve)
plot(occ, panel.first = graphics::grid())